Breaking Technical News
Use of Big Data
Posted on May 19 2025 at 11:17
Last week, we had meetings with a firm who carry out drone surveys. I may have mentioned previously that we in Terrenus use available LiDAR data in many parts of our work. This ‘Light Detection and Ranging’ type of data is essential for all of the detailed flood risk assessments that we carry out - providing a key part of the model inputs. Good quality information is available from Government - Scottish Remote Sensing Portal, at least in the Central Belt, however, in many other parts of the country, the data is patchy and we are currently investigating commissioning our own surveys to improve our hydraulic models.
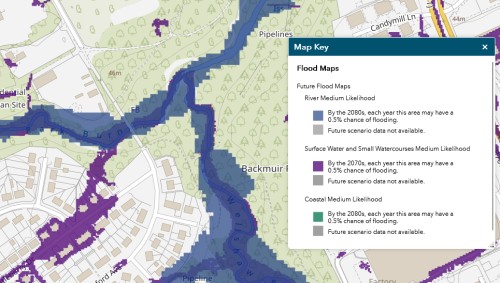
A good way of looking at this type of LiDAR data is to login to the SEPA Flood Map. There you will see (below) that the fluvial risk analysis is more ‘blocky’ than the surface water risk analysis, due to the SEPA surface water modelling being more recent than the fluvial modelling. In both cases however, the SEPA models are a compromise which (amongst other reasons) is why you cannot depend on them for Planning purposes. Any bespoke consultants model will (or should) use refined datasets and more detailed knowledge of the site in order to provide a much better understanding of flood risk for a particular site.
The upshot is that, if you want or need to challenge the SEPA data (as you often do for Planning approval) you will need a more accurate model that SEPA provides. At Terrenus we take pride in doing just that.
If you wish to know more about this topic, please do not hesitate to contact the office and we can talk you through your site-specific examples or in general the impacts of this change.
